Business Intelligence & Performance Dashboards for IDD and HCBS Providers
Turn Data Into Actionable Insights for Your Agency
Therap's Business Intelligence Dashboards aggregate your organization's data into clear, visual analytics, helping leadership make informed decisions that directly improve individual care. In the human services field, your agency collects vast amounts of daily information — from incident reports to billing and goal tracking. Therap makes it easier to harness that data.

Functionality

Incident & Risk Trends
Monitor incident reports to identify safety patterns and implement timely interventions.
See the full Incident Reporting
page

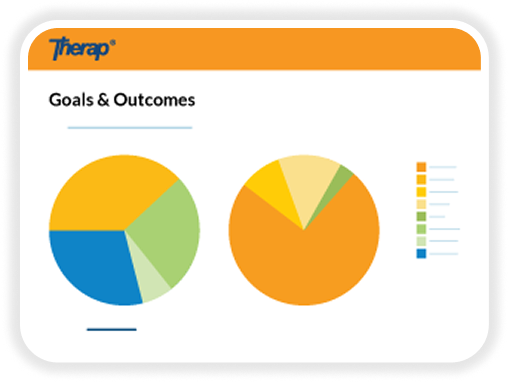
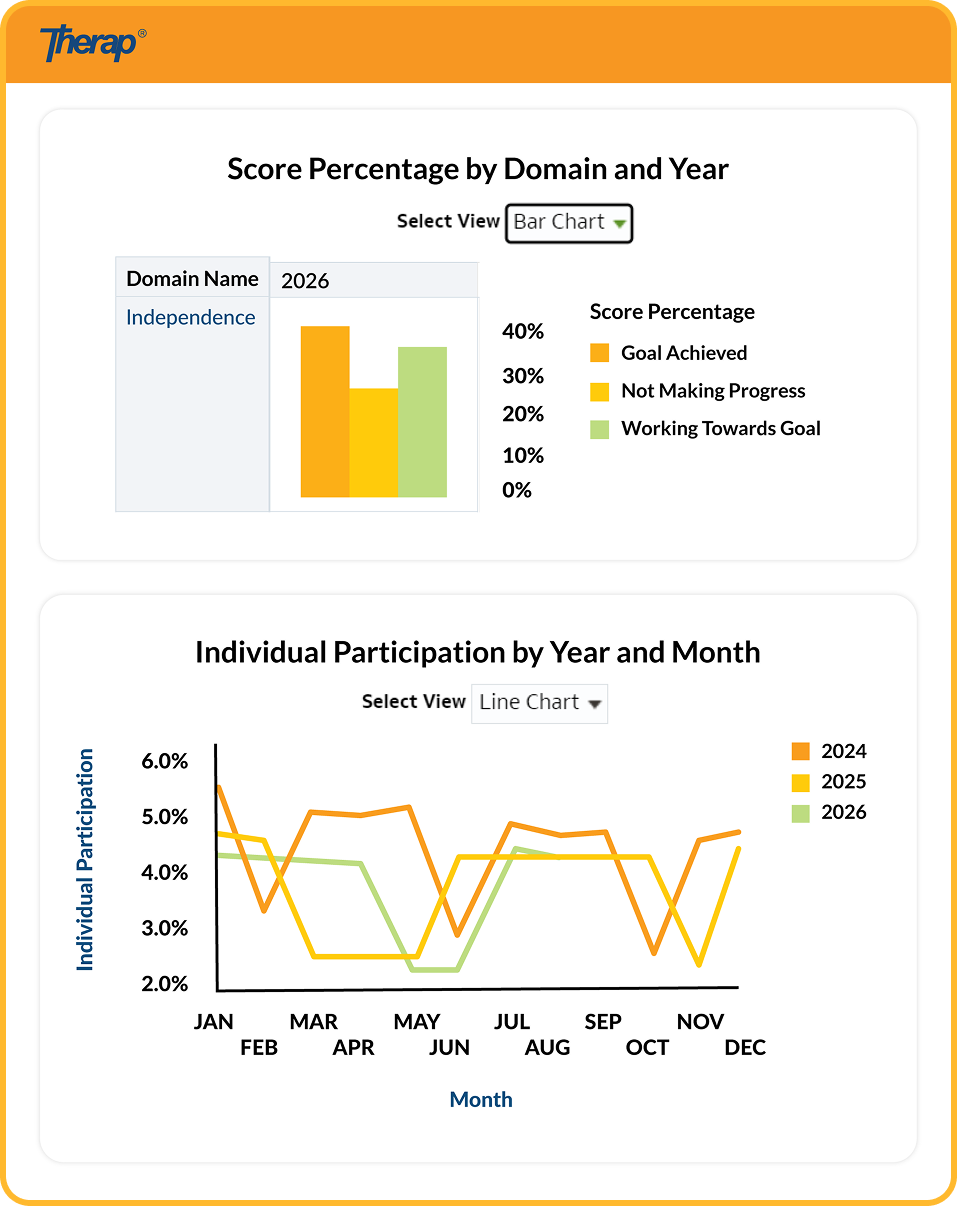
Goal & Outcome Progress
Measure individual achievements against support plans to evaluate service effectiveness.

Health Tracking Metrics
Review clinical and health data across your population to spot high-risk indicators early.
See the full EHR
page

Billing & Utilization Data
Track claims, service authorizations, and financial trends to protect your agency's revenue.
See the full Billing
page

Demographic Insights
Analyze aggregate data on the individuals you support to allocate staff and resources effectively.

Configurable Visualizations
Customize the graphs and charts that present your critical operational data at a glance.
Benefits

Make Informed Decisions
Replace guesswork with clear visual trends backed by real-time documentation from the field.
Enhance Quality Assurance
Identify compliance gaps or recurring care patterns quickly, allowing for proactive adjustments.
Demonstrate Value-Based Results
Easily share outcome metrics and performance evidence with state funders, auditors, and families.
Hear From Our Users

“I'm excited to get everything at a click of a button with Business Intelligence and be able to provide those successes and challenges in data form to the organization leaders, the cabinet, and the board. When things are simple, we get good data. Good data leads to understanding where our successes are [and] where our challenges may lie. In my opinion you can't really argue with data‑it's just there.”

“I used to have to manually calculate percentages to get what we're trying to look for. With Business Intelligence, it's just a click of a button, and it [reduces] the amount of time that I've spent running reports and calculating the data. That's been super helpful.”
Therap Ratings and Reviews
Frequently Asked Questions
How is access to Business Intelligence Dashboards controlled?


Access is configurable based on user roles and caseload permissions assigned by your Program Administrator, protecting sensitive information while delivering data to authorized users.
What areas of agency operations can I view on the Billing Intelligence Dashboards?
Therap’s Business Intelligence platform provides dashboards for Demographics, Health Services, Incident Reports (General Event Reports), Case Management, Employment, Goal & Progress Tracking (Data-Driven Outcomes), Billing, and more.
Can we create custom visual charts?
Yes. The platform features configurable graphs and visualizations that allow you to segment, filter, and view data at the agency, program, or individual level.
How does Business Intelligence support executive and leadership teams?
It consolidates high-level data across billing, health services, and incident reporting into visual overviews. Executives can track organizational health, identify service gaps, and make proactive operational decisions without sifting through individual records.
How do these Business Intelligence dashboards help with state and federal compliance?
By aggregating data on critical incidents, service utilization, and goal tracking, the dashboards allow your team to run targeted audits, spot potential issues early, and provide clear proof of service delivery for regulatory reviews.