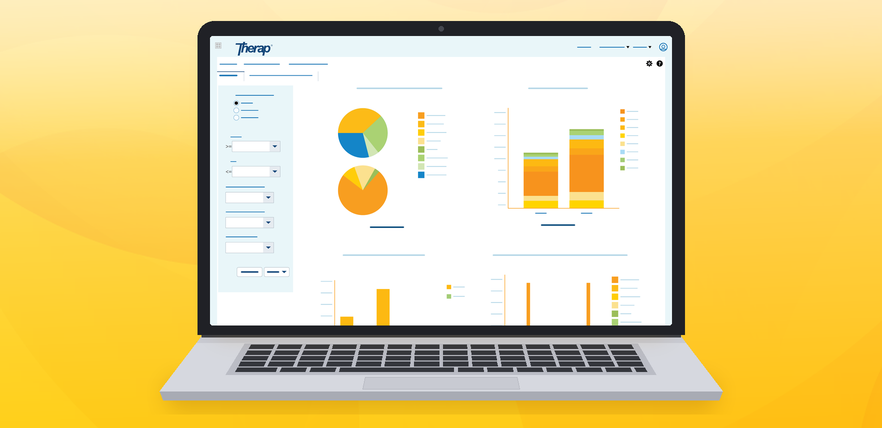
Data drives modern agencies. In the human services field, providers collect vast amounts of information daily, ranging from daily service notes to health records and incident reports. Yet, having data and using it effectively are two distinct challenges. Documentation serves as the foundation for compliance and quality care, but it is frequently siloed and difficult to analyze. This is where business intelligence enters the picture. Business intelligence transforms static records into dynamic, actionable insights, empowering agencies to make informed, strategic decisions. Business intelligence refers to the tools and strategies used to analyze data and present actionable information. For human services providers, it means moving beyond simply storing records. It involves aggregating health, incident, and financial data to identify meaningful trends. When agencies leverage business intelligence, they gain a clear view of their operational health. Instead of manually sifting through paperwork or isolated software systems to find answers, directors and supervisors can view centralized dashboards. These dashboards highlight areas needing attention, such as spikes in behavioral incidents, gaps in service delivery, or staffing shortages. Access to real‑time analytics allows leadership to shift from a reactive stance to a proactive strategy. The primary goal of human services is to improve the lives of the individuals supported. Analytics play a crucial role in person‑centered care. By examining aggregated documentation, providers can identify successful interventions and areas where an individual might need adjusted support. It takes the guesswork out of service planning. Moreover, business intelligence tools help agencies demonstrate their value to stakeholders and state funders. Clear, data‑backed reports validate that an agency meets regulatory standards and delivers high‑quality outcomes. To fully utilize business intelligence, agencies require a comprehensive electronic health record and documentation system. Therap Services provides a specialized suite of tools designed specifically for the intellectual and developmental disabilities and human services sectors. Therap's Business Intelligence Dashboards offer a robust solution for agencies looking to turn their documentation into decisions. Therap's platform helps agencies capture data at the point of service. Whether staff are entering a daily note, updating an individual support plan, or recording a health metric, the information flows securely into the system. The Business Intelligence Dashboards then aggregate this data, presenting it in visually digestible formats. Empower your agency to make confident, data‑driven decisions. Contact the Therap team today to see how our Business Intelligence Dashboards can elevate your services. Business intelligence refers to the technology and practices used to collect, analyze, and present data. For human services, this means analyzing documentation to improve care quality, agency operations, and compliance. Therap offers specialized dashboards to make this process intuitive. Therap’s Business Intelligence Dashboards come prebuilt and require little setup time. Because the platform is designed to seamlessly integrate with existing Therap modules, agencies can start generating insights as soon as data is entered into the system. Therap provides robust Business Intelligence Dashboards that aggregate data from various modules within the platform. This allows providers to generate comprehensive reports, track trends, and monitor quality assurance metrics in real time. Yes, by analyzing health and progress data over time, agencies can identify which interventions work well. Therap's tools give support teams the insights needed to adjust support plans proactively and focus on positive outcomes. Yes. Therap's Business Intelligence Dashboards are highly configurable. Agencies can tailor views to display information as pie charts, bar charts, line graphs, or tabular data, allowing supervisors and directors to toggle between high-level trend analyses and granular data reviews. No. Therap designs its platform to be user-friendly for human service professionals regardless of their technical background. The dashboards present complex data in clear, visual formats, making it easy for management to interpret. Business Intelligence for Human Services: Turning Documentation Into Decisions
Understanding Business Intelligence in Human Services
Turning Data Into Better Outcomes
Harnessing Your Data with Therap
Key Features of Therap's Business Intelligence Tools
Take the Next Step
Frequently Asked Questions
What is business intelligence in the context of human services?
How long does it take to set up Therap's Business Intelligence platform?
How does Therap help agencies analyze their data?
Can business intelligence tools improve individual care?
Can agencies configure how data is visualized in Therap's BI Dashboards?
Is technical expertise required to use Therap's reporting tools?

